This is a cut-down version of the Treasurer's report to the Association annual meeting on 27-Mar.
Before getting into the details of our financials, you need to know that historically, the Association has run on the "cash" accounting method which means that expenses are allocated to the period in which they are paid rather than the period in which they are due. In order to do the kind of analysis I'm about to do though, it's helpful to have things allocated in the period in which they are due. This gives a better view into what the true costs are for running the association by correcting for situations such as where we were late getting invoiced for landscaping services at the end of 2016. When those bills were finally received and paid in February of 2017, It suddenly looked like we had a $28,000 landscape bill. There were several instances in our historical financials going back to 2013 where that sort of thing happened or where expenses were miscategorized. I've spent a great deal of time going through our records and correcting these instances to come up with a set of "pro forma" financials in order to present the information below. With that out of the way, let's get started.
There are 1293 homes in Canyon Creek, each paying an annual Regular Assessment of $400. This gives a top line, fixed income of $517,200 to work with. In 2017, on a pro-forma basis our direct operating expenses (i.e. excluding all non-recurring items) broke down as follows (the unlabeled wedges are things like legal, accounting, postage, copies, etc.):

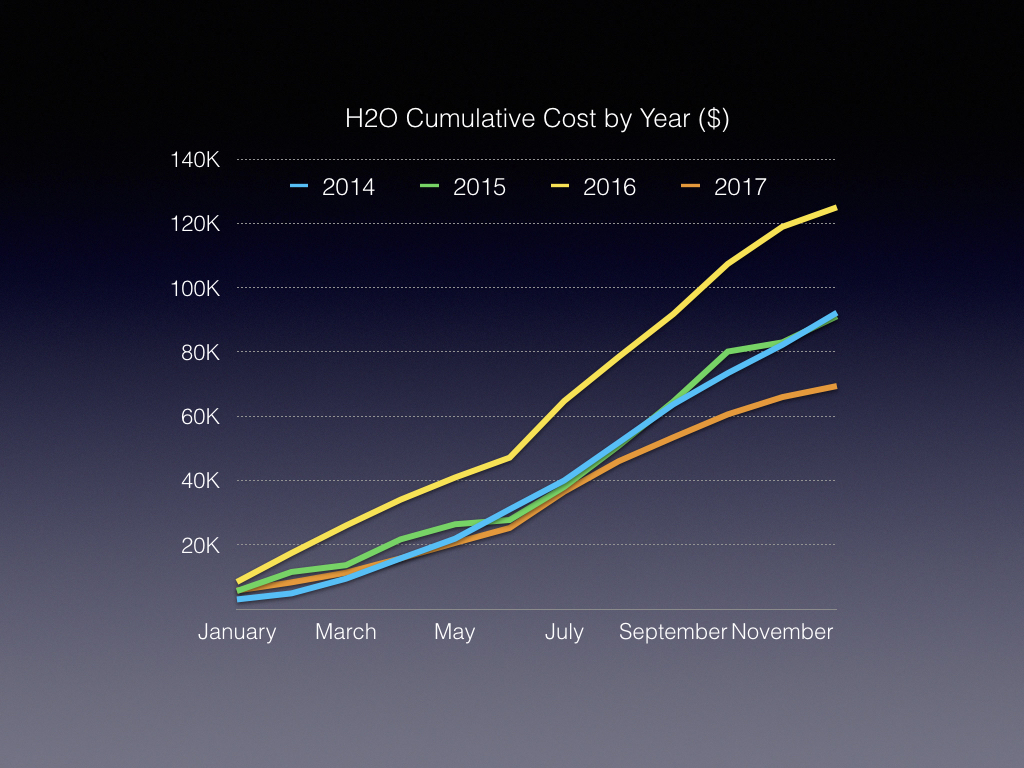
At the end of 2016, we re-bid and consolidated landscaping and irrigation services which reduced the base contract costs by around $15,000. We also had the irrigation staff aggressively manage our irrigation controllers which resulted in a water expense savings of around $20,000 compared to historical trends. We’re not necessarily expecting that level of savings going forward because of seasonal weather effects and the upward trend in water rates, neither of which we have any control over. The chart below shows our cumulative water expense by year. 2016 was clearly an outlier year we attribute to AT&T's fiber tunneling that resulted in damage and leaks in our irrigation system.
We also looked at insurance last year and found that we were underinsured. This led to the Association raising its coverage limits with commensurate increase in premiums as you’d expect. The premium increase is not reflected on this chart but will hit in 2018 bringing the total just under $20,000 annually.
Management fees were looked at last year starting in October and are pretty much inline with everyone else in this business for a community our size. The change in management company is not resulting in any material impact on the budget but we are expecting better service, support, attention to detail and follow through going forward.
Pool operations is the last of the big ticket items that we have not re-bid at as of yet. At this point, we're working on modifications to our phone and internet service supporting the pool area security cameras and emergency phones that will allow us to consolidate lines and reduce costs. We've also made some investments in LED lighting at the pool parking lot that will reduce our electric bills. This investment has a break-even ROI of about 24 months.

For three of the previous five years, the Association has run operating deficits totaling over $208,000. The most recent two years have resulted in small surpluses totaling just over $56,000, largely because we funded only the most necessary maintenance needs and few aesthetic improvement to the community while simultaneously working to reduce operating costs. (And remember, $20,000 of the 2017 surplus was due to unexpectedly large reductions in water usage.)

To get a sense of the true operating costs for the Association, I developed the chart above which reflects the following changes: 1) fixes the mis-classification from prior years of various expenses to the wrong categories; 2) reduces the outlier water expense in 2016 to a more appropriate number based on historical average; 3) it excludes all "discretionary" non-recurring expenses including those related to the bathhouse renovation project such as architect fees and surveys. For 2015 the total includes repairs and maintenance to the pool, fence and irrigation system. It excludes various landscape improvements, tree plantings, and upgrades to the pool park security system that benefitted the property but, strictly speaking, weren't required. For 2016 the total includes fence maintenance, repairs to the pool and courts, electrical repairs to lighting and some landscape work. For 2017 this includes fence maintenance, tree trimming and repairs to the pool awnings. Not included is the stone and mulch work along Boulder Lane that year. Again, that work benefitted the property but strictly speaking wasn't required. What you're left with reflects the cost to run the Association if you fixed things as they break but made no other improvements to the property.
Aside from the non-recurring maintenance and upkeep needs that are budgeted annually, the sole discretionary spending item in the budget is for community events; usually around $6,000 each year. This includes the pool party, the holiday fest, Easter egg hunt and the garage sales. All other items in the budget are non-discretionary and directly apply to the operations of the Association and its duty to maintain the common areas and amenities whose ongoing maintenance and repair needs are being underfunded.
The chart above is presented in order to illustrate the upward trend in operating and administrative costs to the Association even with $35,000 less in water and mowing expenses realized in 2017. Were it not for the intense focus on operating costs and the deferral of necessary maintenance and upkeep expenses, the HOA would be running more deficits.
After more than doubling from 1993 to 2003, the regular annual assessment amount has held steady at $400 for the last 15 years. Were this amount to simply have kept pace with inflation over this period, assessments today would equal $538. A fiscally sound policy for setting the regular annual assessment would be to have the budgeted direct operating and administrative expenses covered by no more than 80% of the regular assessment amount with the reminder allocated to the Association's capital accounts for major capital improvements and unplanned repairs. If we use round numbers of $500,000 for the expense budget; that implies an assessment amount of $625,000 for a per household assessment in the neighborhood of $483. The governing documents of the Association limit the regular assessment increase to no more than 10% annually. For 2019, that would be capped at $440 or stated another way, an increase in current rates of 11 cents a day.